

NOTE: On June 8th, Christopher Coomer, VP of Data, Analytics, and Insights at NPD, covered the essentials of GA4 in a short presentation. You can watch a recording of this webinar here. Those who attend will receive a free follow-up guide to help them migrate to GA4.
Google officially sunset Universal Analytics in June of 2023. Universal Analytics stopped processing new data at the start of July 2022, and customers will lose access to the platform on July 1, 2024.
I’ve heard from a lot of marketers and business owners who weren’t excited about the switch. Change is always hard, but I really think GA4 will be seen as a great update in a couple of years. For starters, it provides a ton more data and is more customizable—which means you can track what matters to you, not just what Google thinks might matter to you.
This guide walks you through everything you need to know about Google Analytics 4, how to make the switch if you haven’t already, and how to get started with the new platform.
What can you expect? New report functions, enhanced features, and predictive insights make this new generation of GA more powerful than ever.

What Is Google Analytics 4?
Let’s start with the most common question people have: what is GA4?
Google Analytics 4 is the newest version of Google Analytics. This is a whole new generation of web analytics that allows marketers to effectively analyze important customer usage metrics, not just track traffic.
Google Analytics 4 tracks the entire customer path across multiple platforms and leverages AI and machine learning to provide more detailed insights into how users interact with your website and app.
GA4 is also focused on customer privacy. This comes in the face of some of the latest privacy laws, such as GDPR and CCPA. With privacy-first tracking, cross-channel data measurement, and AI-driven predictive analytics, GA4 is an advanced tool that provides unparalleled insights.
What is the Difference Between Google Analytics 4 and Universal Analytics?
The most obvious difference between Google Analytics 4 and Universal Analytics is that GA4 enables you to report on activity that occurs on both websites and applications. There are a number of other differences, including:
1. Google Analytics 4 Has a New Dashboard
The first change you will notice is the entirely new dashboard. It is more streamlined, and many of the reports you are used to are gone or have been moved. The navigation bar to the right includes buttons for home, reports, explore, advertising, configure, and library.
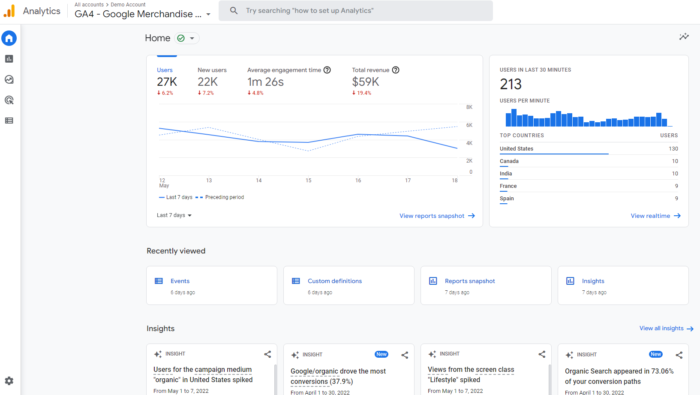
At the bottom, under Insights, you’ll see predictive insights based on Google’s AI. I’ll dig more deeply into the features and what they mean in a later section, so keep reading!
2. All Measurements Are Events in GA4
With Universal Analytics, page views were the most important metric. With Google Analytics 4, all measurements are events. Instead of seeing generalized data, you can now gain a fuller understanding of how users interact with your app and website.
You can use GA4 to track the user experience from start to finish—and from platform to platform. This even applies to tracking assisted conversions.
Assisted conversions, if you didn’t already know, are all the touchpoints and interactions that a customer has with your brand on their way to a conversion. That includes things like paid ads and social media posts, meaning GA4 will let you see how all of your marketing efforts contribute towards a sale.
What does this mean for you? You can still view session-level reporting, but the ability to break it down by interaction means more in-depth reports and insights.
GA4 also has an array of new metrics. These include engagement metrics such as:
- engaged sessions
- engagement rate
- engagement time
It also tracks a number of other dimensions, including attribution, demographics, events, and so forth. Also, bounce rate in GA4 is tracked as the inverse of engagement.
This is a big change, but it actually makes it easier to track customers throughout their journey. GA originally assumed page views were the most important metric—that is no longer true. The new parameters might have a learning curve, but you will have access to more data.
3. Gain Access to Predictive Insights With Google Analytics 4
While looking at past behaviors is helpful in understanding your audience, it doesn’t help you make proactive decisions. With GA4’s powered predictive metrics, you can make data-driven decisions on a large scale.
What does this look like? For most businesses, predictive analytics can significantly impact retargeting campaigns. AI metrics include:
- purchase probability
- churn probability
- revenue prediction
With the above metrics, you can create audiences based on their predicted behaviors. For example, users who are likely to purchase in the next 7 days or users who are likely to spend more than $500 in one purchase.
These audiences can then be targeted using Google Ads campaigns or even on social media.
These metrics can also improve website performance. You can create custom funnels for different audiences based on their behaviors and needs. The suggestions will continue to improve as more data is collected.
4. GA4 Gives Marketers More Control
GA4 allows you to customize the dashboard, enabling you to see the reports that matter most to your business. It even works well in conjunction with Google Data Studio, so you can create custom visualizations of the data collected.
You can also create custom segments based on trigger events, which are essentially a subset of events that occurred on your website or application. This enables you to more accurately track customer interactions.
For example, you can create segments on all conversion events that occurred in a particular location. These capabilities make it possible to take a more granular view of your users and their behaviors.
5. Cross-Platform Tracking
What happens when users are active on more than one platform? With the old Google Analytics, tracking users across platforms was nearly impossible. The new Google Analytics 4 tracks both web and app data in one property (hence the beta name of Google Analytics App+Web).
Cross-platform tracking enables you to see the complete customer journey, including acquisition, engagement, monetization, and retention. You can use GA4 to track the user experience from start to finish—and from platform to platform.
This is done through unique user IDs assigned during app or website login.
With the appropriate gtag.js script, the user ID for each logged-in session will be sent from either the website or the application to Google Analytics. The ID will be reported to the GA4 property, and any user metrics will be logged. When the user logs in again on an alternative platform, the reports will connect the user’s data to their unique ID and pick up where it left off.
This is incredibly useful information for any marketer, as it allows you to better understand the cross-platform experience of your users. The data can also be used to extrapolate information for a generalized demographic and build more accurate customer models.

6. Get Greater Value From Your Data
One of the biggest benefits of moving away from session-based data is the level of detail Google Analytics 4 is able to provide to site owners. Specifically, you can track complex, multi-device buyer journeys.
Exploration reports also allow you to dig deeper into the data you collect. Google offers several pre-built templates for a range of different analyses (funnel exploration, path exploration, etc.), as well as the ability to set up a custom report.
Take the funnel exploration report, for example.
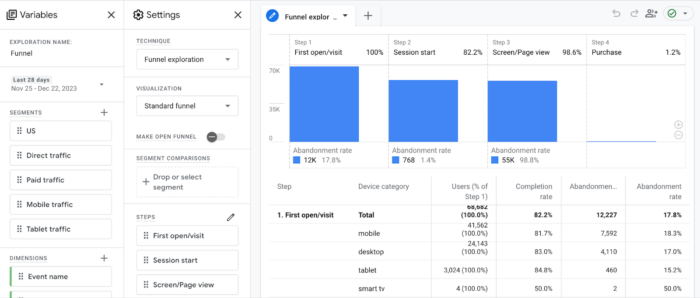
This lets you see the entire customer journey prior to purchase and helps you work out the most common steps users take to become buyers and buyers take to become repeat customers.
This kind of reporting was only previously possible in Universal Analytics using Enhanced E-commerce —and even then, it wasn’t as good as GA4’s offering.
7. Improve Data Privacy
GA4 makes it much easier to stay in line with various privacy laws like GDPR.
For starters, the platform doesn’t record or store IP addresses. You could see every user’s IP address in Universal Analytics unless you actively anonymized them.
It’s also easier to manage data retention options, allowing you greater control over how you store and delete user-specific data. You can even turn off location-specific data for particular countries.
How to Set Up Google Analytics 4
Another common question I get is about how to set up GA4.
Since Google Analytics 4 can be used for your website or application (or both), there are several different setup processes. I’ve outlined them below.
Alongside an Existing Property
If you still have a Universal Analytics property for your website, then you can set up a Google Analytics 4 property using the GA4 Setup Assistant.
- In Google Analytics, click “Admin” on the lower left of the screen.
- In the Account column, select the desired account:

- In the Property column, select the Universal Analytics property that currently collects data for your website:

- In the Property column, select GA4 Setup Assistant:

- Click “Get started” under “I want to create a new Google Analytics 4 property:”

- If your site uses the gtag.js tag, you can select “Enable data collection using your existing tags.”
- Click “Create Property.”

If you are unable to “Enable data collection using your existing tags,” it’s for one of three reasons:
- Your website builder/CMS doesn’t yet support the gtag.js tag.
- You use Google Tag Manager.
- Your website is tagged with analytics.js.
In all three cases, you’ll need to add the tag yourself.
Google Analytics for Firebase
Firebase is Google’s app development platform that helps you build and deploy apps and games. It comes with analytics included, but you’ll still need to upgrade your account.
To upgrade your Firebase account to Google Analytics 4, follow these steps:
- Log in to the Firebase console.
- Go to Analytics > Dashboard on the left panel.
- Click “Begin upgrade” in the banner at the top of the page.
- Follow the on-screen instructions to complete the upgrade.
Once upgraded, you can find app analytics in both the Firebase console and Google Analytics.
Setting up Google Analytics 4 from Scratch
If you’ve never used Google Analytics before or you want to set up a brand new website, you’ll need to start from scratch:
- Create an Analytics account if you haven’t already by visiting https://analytics.google.com/ navigating to Admin, clicking Create, and then Account.
- Give a name for your new property, and select a time zone and currency.
- Select your industry and business size.
- Choose how you’ll use Google Analytics.
- Click Create.
- Add a data stream to start collecting data.
Note: a data stream is a source of information that feeds your GA4 analytics property. It could be your website or your app. Google will guide you through adding each data stream.
How Do I Use Google Analytics 4?
Now that you understand the power of the new Google Analytics platform, I’ll walk you through how to use it. I will say there is a learning curve for the platform, and that can definitely be frustrating.
Start by following the steps below. This will help you understand the basics and how to navigate the new platform. If you still aren’t seeing the data you need, consider signing up for a longer-form course or reaching out to my team for more help.
Test The New Search Bar
The search bar in GA4 lets you access more information than ever, including instant answers for specific queries (such as “how many users this month vs last year”), specific reports or insights, property configuration, or accessing the help content.
Try a few queries to see what you can access, such as “how to create a landing page report” or “top users by city.” As you learn the new dashboard, the search bar will be invaluable.
Get To Know The New Dashboard
Now let’s look at the new dashboard. At first glance, it might look pretty familiar. Take a look around, however, and you’ll see most of the reports you’re used to are not where they used to be.
Here’s an annotated version of the dashboard. I’ve labeled the navigation bar on the left as well as the different displays. For this walk-through, I’m using GA’s demo account (which you can access here), so it may look a bit different than your version, especially if you’ve already started customizing it.
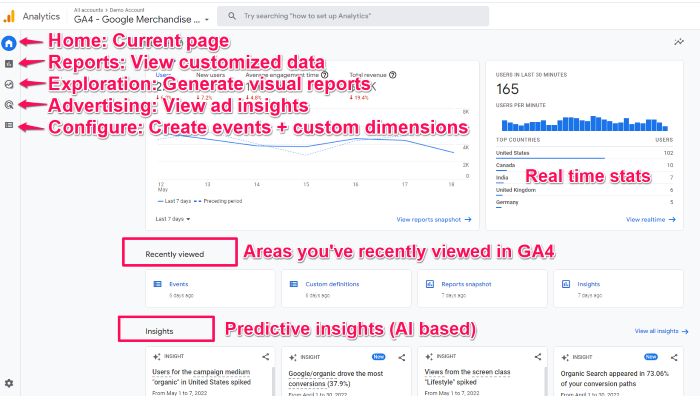
NOTE: A few of the navigation menu items, including Audience and Library, aren’t in this screenshot but should be accessible in your dashboard if you have editor access.
Explore The Reports Dashboard
From the dashboard, click on the second icon on the left nav bar, the one that looks like a graph.
This will take you to the reports dashboard, which shows you snapshots of different reports. Most of the reports you are used to seeing are in this tab, though they may look a bit different.
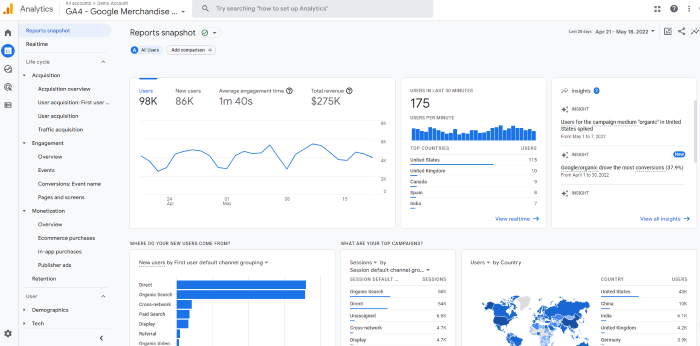
There’s a ton of data here. I won’t walk through all of it because different sites will track different metrics, so yours might look different.
But let’s say you want to see how many people viewed a specific page. In this dashboard, you’d click “engagement” and then look at the “Views by page title and screen class” chart.
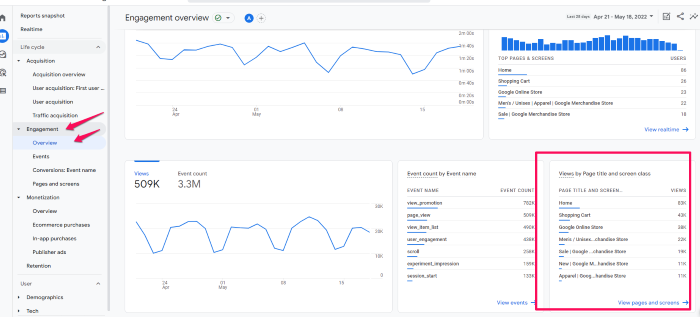
You can also view acquisition, monetization, and user demographics here. If you want to compare different metrics, select the + icon at the top (next to Engagement Overview.)
Customize Your Reports Snapshot
One of my favorite features is the ability to customize the reports snapshot so you can see the data that matters most to you at a glance. This will also help you get to know GA4 a bit better so you are more comfortable using it.
First, let’s create a new report.
To start, click Library at the bottom of the left navigation bar. Note, if you don’t see this option (It’s not in the demo account), it means you don’t have admin access.
Then, scroll down to the Reports table and click Create a new report. Then, select Create an Overview Report. You’ll be asked to provide the data source and GA4 will walk you through creating the report. (This part changes based on the type of report.)
If you want to change the layout of your overview, click the six dotsdrag indicator. This will let you drag and drop the cards. To remove cards, click the X icon. If you want to add new cards, select +Add Cards.
Create A New Event
Events are crucial in the new Google Analytics—in fact, this is how you’ll track just about everything. You will need an editor role in GA to make these changes, so if you don’t see the options I mentioned, that may be the issue.
- To create a new event, head to Configure > Events.
- Then click Create Event.
- Choose the data stream (If you have more than one property in GA).
- Tap Create.
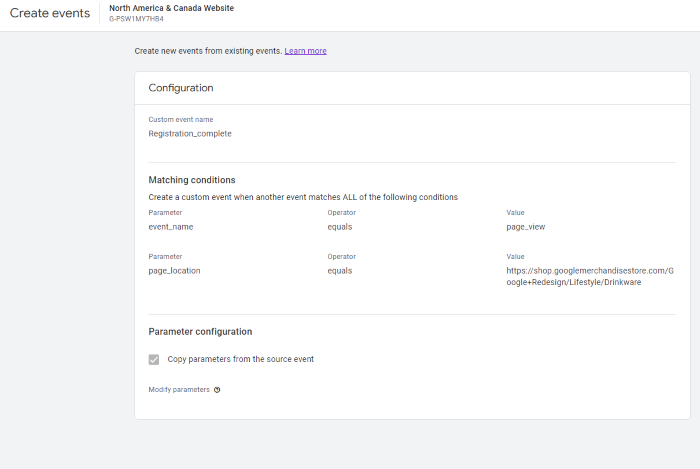
- Give your report a name. I suggest creating a naming convention and sticking to it. For example, using <audience location, acquisition channel>, a report might be named “US visitors from social” or similar. Creating a standard naming convention will help keep you organized.
- In the “Matching Conditions” field, enter the existing event this will be based on, such as “click.”
- If you want to use the same parameters as the original event, select “copy parameters from the source event.” For example, if you want your new event to be triggered when a click occurs and already have an event for that, you’d check this box.
- Specify any changes you want to make to the new event. For example, if you want to track when someone clicks and then takes another action, you’d add it here.
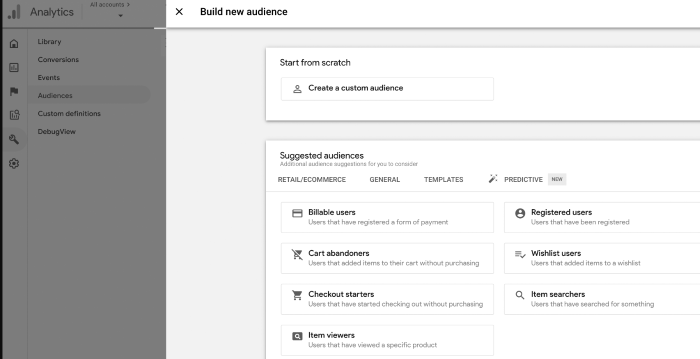
See Suggested Audiences
Google Analytics 4 now suggests new audiences. If you’re looking to expand your user base or break into new markets, this can be crucial information. When you create a GA4 property, you’ll tell Google about your business, including your industry category.
Google uses that information to generate new audiences that may be a good fit for your business. To view this data, head to Audiences, under the Library. You’ll see suggested audiences listed under Build a New Audience.
Check Out Path Exploration
Path exploration is a type of GA4 exploration that shows the sequence of pages users visit and the actions they perform.
You can use path exploration to:
- Find the most commonly visited pages after the homepage
- Identify loops where users become stuck
- See the actions most commonly taken after a particular page view
Here’s a sample path exploration report from the GA4 demo account:
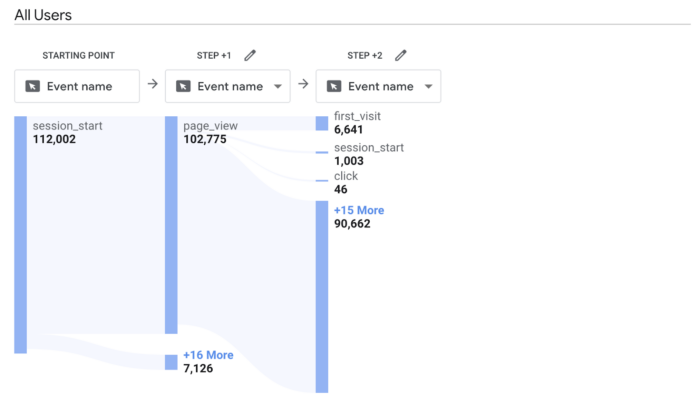
As you can see, it uses a tree graph to visualize user behavior from their first event (the session start) to the third event.
The graph, which can be found under the Explore tab in the left-hand sidebar, is highly customizable.
You can change input variables to provide a more detailed report. This includes changing:
- Location
- Gender
- Traffic source
- Device category
You can also change the report layout using the dropdown boxes at the top.

By changing the Step +1 to show the Page title and screen name and the Step +2 box to show the Event name, I can now see the actions that users took after landing on the homepage.
Over the last 28 days, 31,765 people landed on the homepage after starting their session, and 11,488 viewed a promotion next. By knowing that was the most popular visitor flow, I can feel confident that changing my promotions will have a big impact on user behavior.
Frequently Asked Questions About Google Analytics 4
Why has Universal Analytics switched to GA4?
Universal Analytics has transitioned to Google Analytics 4 (GA4) to adapt to the changing way customers interact with your brand. GA4 offers a more comprehensive, cross-platform view of the customer journey, integrating data from both websites and apps.
Unlike Universal Analytics, which relies heavily on cookies and session-based data, GA4 uses an event-driven data model, making it more adaptable to a future where cookies are less prevalent. This shift also addresses the growing demand for privacy-focused analytics, as GA4 provides more robust privacy features and better aligns with data protection regulations.
Ultimately, GA4 gives you access to more useful and granular data in order to monitor user behavior and improve your marketing efforts.
Is Google Analytics 4 free?
Similar to Universal Analytics, Google Analytics 4 is a free property type. There are no costs associated with using one (or more) GA4 properties on your account.
Can you run Google Analytics 4 and Universal Analytics at the same time?
Yes, you can currently run both platforms parallel to each other. UA will stop gathering data in the summer of 2023, so make sure you’ve installed GA4 even if you aren’t ready for the switch quite yet.
Why is Google Analytics 4 so hard to use?
GA4 is extremely customizable, which can make it hard to learn. However, once you get a hang of it, you’ll find you have access to deeper insights you can use to grow your business.
What happens if you don't switch to GA4?
If you don’t switch to GA4, you’ll eventually lose access to the platform. This means you won’t receive updates, and your historical data won’t be transferred automatically to GA4. In the meantime, businesses and users relying on Universal Analytics will miss out on GA4’s advanced features, like AI-driven insights, improved integration with Google’s advertising platforms, and more granular data controls. To maintain a continuous flow of insights and data-driven decision-making, transitioning to GA4 is essential.
How does Google Analytics 4 handle user tracking and privacy concerns?
Google Analytics 4 addresses user tracking and privacy concerns by providing more control over data collection and usage. GA4 does not store IP addresses and uses machine learning to fill gaps where data is incomplete due to privacy settings. It’s designed to work in a cookie-less future and complies with regulations like GDPR and CCPA. Additionally, GA4 provides more transparent data collection practices, giving users a clearer understanding of what data is collected and how it’s used.
An In-Depth Guide to Google Analytics 4: Conclusion
Google Analytics 4 is a powerful analytics tool that provides invaluable insights into your audience. There are numerous benefits to GA4, including cross-platform tracking, more control over data, and AI-driven insights.
Fortunately, setting up a GA4 property on your website or app is easy. The steps outlined above should take you less than 10 minutes to complete, so there’s no excuse to put off the transition.
With that said, there may be a lot of questions you still have about how to make the switch effectively, as well as how to make the most use of GA4 when you do so. I’ve got your back.
With my on-demand webinar, Ready, Set, GA4: How To Simplify Your Move to GA4, you’ll have all the info you need about what makes GA4 the future of analytics, and how you can set yourself up for success on the platform.
Have you made the switch to Google Analytics 4? I’d love to hear your thoughts in the comments.

See How My Agency Can Drive More Traffic to Your Website
- SEO - unlock more SEO traffic. See real results.
- Content Marketing - our team creates epic content that will get shared, get links, and attract traffic.
- Paid Media - effective paid strategies with clear ROI.
Unlock Thousands of Keywords with Ubersuggest
Ready to Outrank Your Competitors?
- Find long-tail keywords with High ROI
- Find 1000s of keywords instantly
- Turn searches into visits and conversions
Free keyword research tool
