Content is a driver of your business.
In the B2B environment, the goal of producing content is to attract people to your business and the solution that you offer by positioning yourself as an expert.
It’s the same thing in the B2C space except on a bigger and wider scale.
Instead of going after the key decision makers for a business, you are trying to use content to attract an audience. Then you can convert them into customers by getting them to buy your product or service.
And while many people may think that content is subjective, I’m here to tell you that it’s possible to measure your content’s engagement, and therefore know just how effective it is.
The basic reason why most people think it’s subjective is that content marketing can take a long time.
But when you break down your content strategy into small pieces, you start to get a clearer view of how well each part is – or isn’t – working.
Instead of shifting your entire content strategy at once, you can focus on improving different aspects and elements one at a time.
If you change everything at the same time, you won’t know what’s responsible for the shift in performance. Multiple changes might offset each other and your content strategy will stagnate.
It’s also very important to understand the difference between your content’s performance and your content’s engagement.
You might think that those terms are interchangeable. They are not.
In this article, I’m going to start by explaining how to calculate your overall content performance.Then, I’m going to show you what to focus on so you can correctly measure your content’s engagement – and not get the two confused.
Then, I’m going to show you what to focus on so you can correctly measure your content’s engagement – and not get the two confused.
How to measure your overall content strategy’s performance
Content marketing is just like any other form of marketing in that there are costs associated and a return on investment in the form of sales.
Here is an old-school example from direct mailings:

It’s easy to measure direct mailing because it’s physical. There are a certain number of pieces and an associated cost.
It might seem like the cost of creating your content is more nebulous and difficult to translate into monetary terms.
But it’s actually pretty straightforward.
First, add up the time it takes to produce your content. This calculation is fairly easy if you are getting paid a salary.
Figure out how much you are paid per hour (after taxes). Then, time yourself during the content creation phase to see how many hours you spend on one piece of content.
It’s even easier to calculate if you are working with a freelancer who charges you by the word, hour, or completed article.

It’s a bit more difficult if you are an entrepreneur. You will have to estimate how much your time is worth.
There is no way to define this scientifically. You just have to go with a guess that feels right.
You could take the middle ground and envision having a salary after taxes of $50,000 per year.
If you are working 12 hours a day, 5 days a week (which might be on the low end considering how much entrepreneurs need to work to get their business off the ground) that calculates to about $17 per work hour.
If it takes you 4 hours to complete a piece of content, that content just cost you an estimated $68.
What you want is the monetary equivalent of what the content took to produce.
Then, you need to add in other costs like boosting your content on social media or if buying the rights to images on stock photography sites.
Add everything up and this is the overall cost of your content.
After that, how many people actually come to view your content? I’m not talking about the impressions on Facebook, but the actual visitors that come to that page you just produced.
If you stop there, you can calculate how much you are paying per visitor, similar to how you would calculate your return using display advertising.
This is, however, a rather limited way of measuring your content. Sure, you’re getting people to look at your content. But what are they doing next?
You should be tracking the conversions that come in.
I’ve written all about optimizing your sales funnel on your website.
Your content pages make up the middle levels of your funnel, in the consideration and conversion sections.

Google Analytics makes this easy to do with conversion tracking.
Once you know the number of people converting from your content, you have the conversion rate.
You should compare the conversion rates between different pieces of content to see which content is the most engaging for your audience. We will come back to this later.
But you can extend the calculation of the amount of money you spend on your content.
When you know how much money you spend on your content vs how many people convert you can calculate your cost per action (CPA).

That’s how much you are essentially paying per customer via your content.
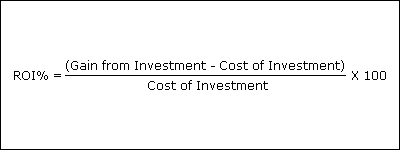
Then, take the total amount that those people coming from your content spend and divide that by your cost of content.
That’s your ROI.
If you’re in the B2B space, the end goal of your content might be filling out a form that becomes a lead for your sales team.
Your calculations work the same way as before, however, the final numbers will probably be substantially higher in certain industries like enterprise tax software.
Then, use a benchmark. Compare your content costs to other advertising channels and your competitors.
How do you stack up?
If your content strategy is costing you way more than other marketing strategies, you will need to change your strategy.
One of the ways to do that is to make your content more engaging.
How to measure your content’s engagement
Now that we’ve established how to check the performance of your overall content strategy, we can start talking about engagement.
Improving your content’s engagement is key to improving how well your content performs.
In fact, it’s the top priority among B2B businesses.

Generally speaking, the more engaging your content, the better it will work.
There are some key areas to focus on besides your conversion rate and ROI that you should use to correctly measure how engaging your content is.
Time spent on page
The first is the time spent on the page. This is different than the session duration in Google Analytics, where Google measures the total time a visitor spends on your site and counts all of the pages they see.
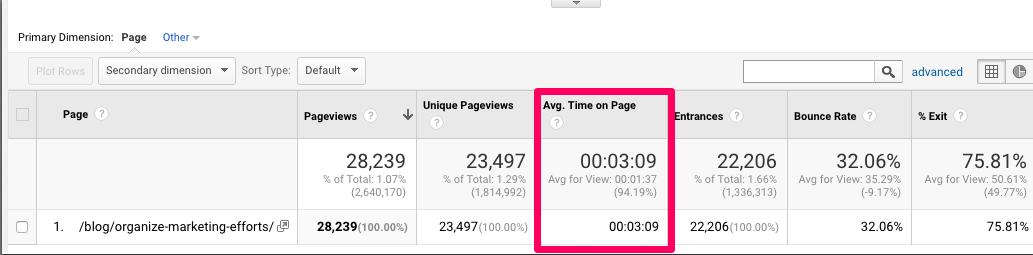
Average time spent on page refers to each page specifically. This is where you see how long the average person spends with a particular bit of content.
If it’s extremely short, that means that people are coming to that page — probably thanks to a good headline — but they are not finding content that engages them.
There is no absolute amount of time to measure here in numerical terms. How long it takes to consume your content depends on the subject and format.
It will obviously take longer to read a 5,000-word article than to scan through a short infographic.
What you should do instead is figure out the time spent on page for each of your content pages.
Then, isolate which ones people spend the most time with vs the pages where people leave the fastest.
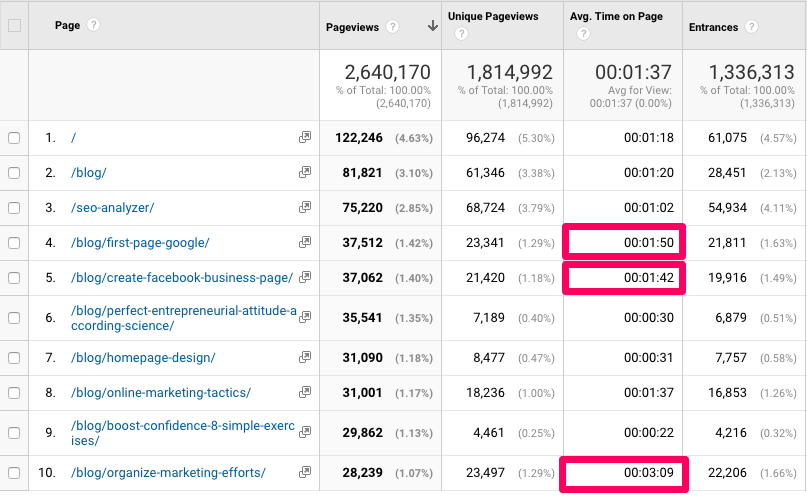
See what the most engaging posts have in common. Can you identify any best practices?
Do the same with the least engaging posts. What are the common pitfalls that you can avoid?
Side note: Time spent on page is the equivalent to view through rate for videos.
The view through rate (VTR) measures the percentage of people who make it to the end of your video compared to the number of people who started your video.
If you’re using video as a part (or all) of your content marketing strategy, you will need to check your view through rates to see which videos have the strongest engagement.
You can access that information on YouTube by going to the analytics tab of your channel. Click on the video you’d like to analyze and scroll down. You will see the average view duration.
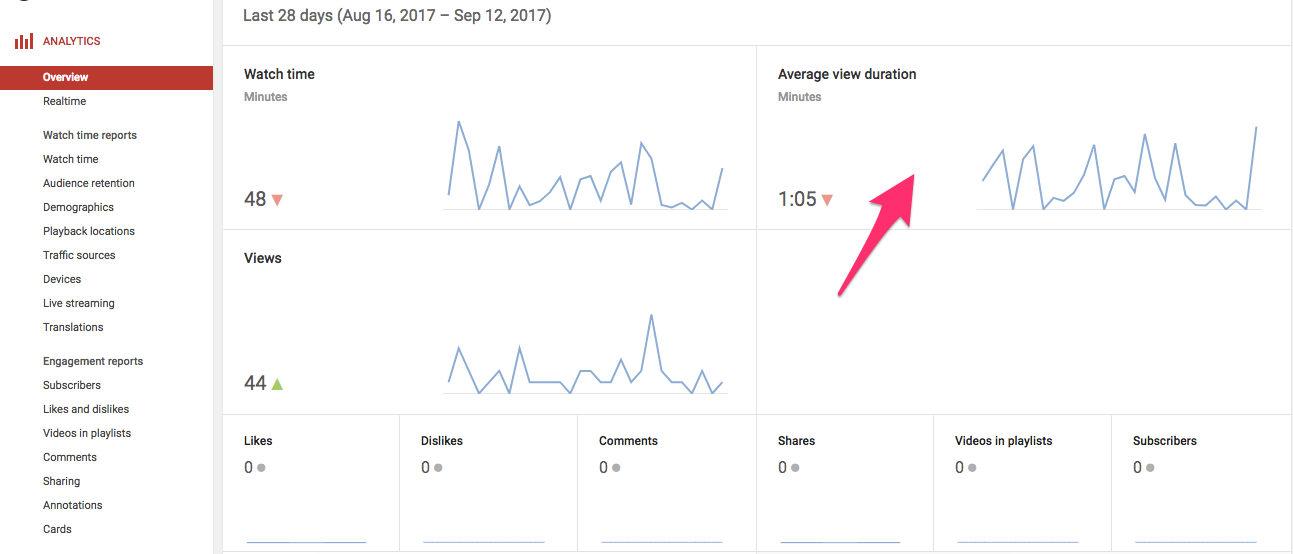
That’s the average amount of time a viewer watches your video before leaving it. Click on it to go deeper.

You will be able to see the curve of people who drop off at certain parts of your video.
On YouTube, the VTR is called average percentage viewed.
VTRs vary enormously between different platforms like YouTube and Facebook.

Again, what’s important is that you do the exercise for all of your videos to see which ones engage the best.
Internal Traffic & Exit Rate
Another sign that your content is engaging people is if they don’t leave your site when they are done with a particular piece of content. Instead, they are so engaged that they click through to your other articles or content.
Flat, non-engaging content will cause people to leave your site.
You can see this in the exit rate metric.
The exit rate is the percentage of how many visitors leave your site after a certain page.
Google Analytics will show you the exits of each page. That’s every visitor to your site who left your site after that particular page.
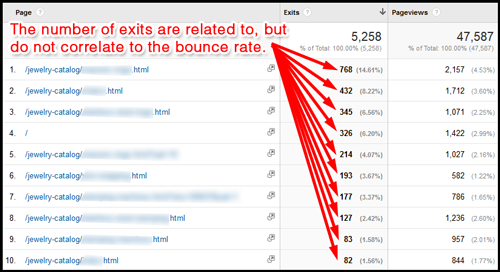
Every page on your site has an exit rate. People will leave your site for a number of different reasons, like when they have something else to do or need to check their email.
Those reasons do not mean that your content isn’t sticky.
It’s just natural.
But some of your content pages will have higher exit rates than others.
That means that instead of captivating people with engaging content, those pages are losing people.
Take those pages with the highest exit rates and try to figure out how to improve the content to make people want to stay longer.
Email sign ups
Chances are, you are using content to attract people to a product or service that you offer.
The content is the part that brings people in thanks to search and social.
The key to creating content is to generate something of value to give to your customers.
Your goal is not to have people come just for the content, but for the content to convert them.

If your content is super engaging, people will want to be notified when you publish something new.
They might follow you on Facebook or another social platform.
But the best thing to do here is to create an email list (if you don’t have one already).
You can embed your email sign up directly into your posts with a call to action that explains why people should sign up. I like how Aeon does it with a minimalist design.

If your CTA refers specifically to the content that you’re posting – and not offers or deals on your products – it’s safe to say that people who subscribe find your content engaging.
Social shares
There are few stronger indicators of your content’s engagement than a personal endorsement from someone you’ve never met who shares your content with their audience.
When talking about social, engagement is normally measured as the combined number of likes, comments, and shares divided by the number of people who saw a post.
But in this case, we’re talking about how engaging your content is, not what your social engagement rate is on any given social platform.
When someone who follows you likes your latest post that you shared, that doesn’t mean that they clicked through and consumed your content.
That is one of the misleading indicators that can take you off track and not help you correctly measure your content’s engagement.
You need to focus on the share.

Organic search traffic
When we talk about engagement, we often refer to engaging people.
Real human beings.
But there is something else that we should focus on engaging too, and that’s Googlebot.
I’ve written all about SEO strategies, and you can use my SEO checker tool to see how your website is performing from a technical standpoint.
In the most simple terms, the goal of search engines is to connect people conducting queries to the most relevant content possible.
If your content is being properly indexed by Googlebot — in other words, it is effectively engaging with Googlebot — your website will start to show up more and more in search results rankings.
The direct outcome of that is that you will see your absolute organic search traffic rise.

It might not change as a percentage of your overall traffic, especially if you are running media campaigns.
Keep a record of the number of visitors driven from search to your website each month.
If that number is increasing month after month, you know that your content is properly engaging Googlebot.
Misleading indicators of your content’s engagement
In the world of analytics, you can spend your time chasing numbers until your head spins.
A lot of those metrics are useful for measuring certain things. Otherwise, they wouldn’t exist at all.
But for measuring engagement specifically, there are a few metrics that you will waste your time with since they are not reliable enough to draw real conclusions.
Time spent on site
At first glance, this might seem like an important metric. It’s sometimes referred to as “session duration.”
But remember what I talked about above? What you should really be looking at is the time spent on a specific content page vs the time spent on other specific content pages.
This is because your site will have lots of other areas like your homepage, about page, your sign-up area, and your e-commerce page.
Some websites, particularly services that are trying to get people to become regular users, will want to push for the longest session duration possible in an overall way.
You are trying to measure how engaging your content is.
If you take the overall time spent on site metric, you will be including all of the people that come to your site for a second and then bounce, or the people who are coming to complain about a product they bought.
Mixing all of those extraneous factors into your calculation means that you are hiding the real measure of your content’s engagement.
Facebook Likes
Many people point to the number of engagements on Facebook to measure the engagement with content.

It’s true that the word engagement is being used there, but when someone likes your post on Facebook, that does not mean that they consumed it.
Many people like content just because it sounds nice and not because they went in, evaluated it, and made sure it was worthy of one of their likes.
When people share your article from your site, this is the true measure of the effect that your content is having.
Conclusion
Now that you understand the difference between your content’s performance and engagement, you can accurately measure the two.
What’s important is how you balance improving your content’s engagement with your content’s performance.
Counterintuitively, when content is too engaging it could come between a visitor and a conversion.
Now wouldn’t that be ironic?
You have to remember that content is a means to an end. Engaging content gets consumed to the end. Content that performs is engaging, of course, but it converts people.
This is why you don’t see companies producing endless cat videos. Sure, cat videos are super engaging. I mean, just look at this:
But that will not create any new paying customers for your business (unless maybe if you are in petcare).
Focus on the most relevant metrics for measuring engagement, put less stock in the metrics that can be misleading, and always keep in mind your overall content performance.
How do you measure your content’s engagement?
Are You Using Google Ads? Try Our FREE Ads Grader!
Stop wasting money and unlock the hidden potential of your advertising.
- Discover the power of intentional advertising.
- Reach your ideal target audience.
- Maximize ad spend efficiency.